
Why is BoP necessary when technical regulations dictate the performance window of a car? PMW investigates where pace can be won and lost in the Le Mans Hypercar class.
The centenary edition of the 24 Hours of Le Mans proved to be one of the most emotional and exciting races in many years. The competition for the win was intense, with numerous cars displaying potential winning pace. Different teams led at various stages of the competition, creating a thrilling battle throughout. The typical Le Mans weather added drama and tension, making race engineers’ jobs even more complex. The ultimate fight for victory came down to Ferrari and Toyota, who battled fiercely until the last hour.
Meanwhile, off the track, last-minute changes to the balance of performance (BoP) in the Hypercar class caused no small controversy in the paddock. The need for a BoP system (see Class wars, page 39) in a class where the cars should be matched by regulation is justified by the many parameters that cannot easily be given targets. This feature will look to understand the performance sensitivity of these parameters at Le Mans, and assess their impact on lap time.
Meanwhile, off the track, last-minute changes to the balance of performance (BoP) in the Hypercar class caused no small controversy in the paddock.
For example, mass distribution front to rear is used to tune car behavior, and the center of gravity height is also critical for race cars. The regulations mandate the height of the center of mass of some key components, so there are no huge differences between different manufacturers, but each car still has some variation.
Suspension design and kinematics is another important differentiator and can play a significant role in terms of performance. This includes suspension systems compliance, which, together with kinematics, defines how the wheels are placed dynamically with respect to the road and influences how the tires are exploited.
Even in respect to the aerodynamics and powertrain power, which the regulations define so strictly, there can be differences that are worth significant pace on track, even though the cars still fulfill the homologation criteria.
Performance constraints
For powertrain, the regulations stipulate not only the maximum power for each engine speed (power curve) but also how the targets can momentarily overshoot and for how long. In terms of design, the key is for the teams to stay as close to the power target as possible without being over it and risking a disqualification. Besides the combustion engine itself, a key factor is how the teams can control the instantaneous power at the wheels, balancing the ICE and the electric motor (if the car is a hybrid). Critical is how much tolerance they need to build into the system to avoid going over the regulation targets. This control is closely related to how effective their control systems and strategy are. It would be nearly impossible to hit the exact power target all the time, so teams must retain a small safety margin under this target.
With respect to the aerodynamics, there are some aspects that could make a difference between two cars, even if both fulfill the regulations and achieve homologation
With respect to the aerodynamics, there are some aspects that could make a difference between two cars, even if both fulfill the regulations and achieve homologation. The rules dictate how the performance of the cars (compared with the targets) must be measured and calculated. For drag, the reference condition is representative of an end-of-straight scenario in terms of ride height (considered to be the lowest setting); however, for downforce the definition is more complex and is based on a weighted average over a wider range of ride heights, roll angles and yaw angles.
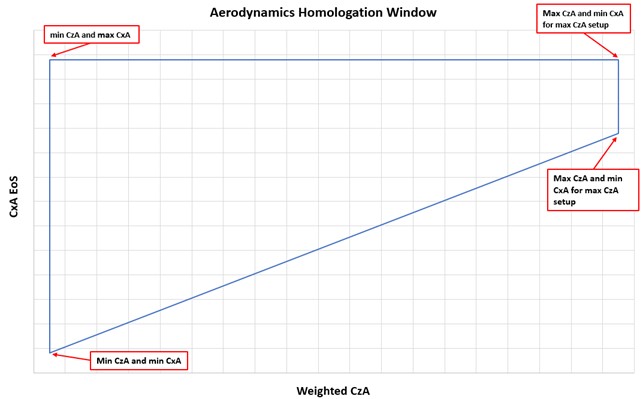
Moreover, in each aerodynamic configuration (this includes any possible setting of the single adjustable aero device the cars are permitted to deploy – an adjustable rear wing, for example), the two target values calculated as above must remain within a given window. This is shown in Figure 1. Cx and Cz are respectively the drag and downforce coefficient of the car; they are multiplied by the frontal area to get to CxA (vertical axis) and CzA (horizontal axis) as shown in the diagram.
BoP in action
In a scenario without balance of performance regulations, each team’s objective would be to position itself along the lower diagonal line of the diagram. This line connects the configurations with minimum and maximum downforce at the minimum allowed drag. BoP serves to level the playing field for cars that might perform in less advantageous areas of the homologation window. For instance, some teams may sacrifice performance to incorporate styling cues linked to a manufacturer’s road cars.
Furthermore, teams will have invested significant effort in manipulating the aerodynamic behavior of their cars, specifically how much downforce and drag are generated at different attitudes, such as front and rear ride heights, roll and pitch angles.
The effects of these aspects, as well as the adjustments made to the balance of performance just before the 24 Hours of Le Mans, are thoroughly analyzed. The adjustments were controversial, not only due to their favoring the winning Ferrari team but also because the FIA/ACO had previously assured teams that no BoP adjustments would be made until after Le Mans.
Methodology
To conduct this analysis, the author used a lap time simulation tool that he developed and deployed with active sportscar racing teams.
A model of a rear-wheel-driven LMH/LMDh vehicle under qualifying conditions was created, based on data found within the regulations, in addition to information gathered by the author, including insights from engineers working in various WEC teams. Vehicle mass and maximum power values were those assigned to Cadillac for Le Mans. The LMH tires were modeled based on data from LMP2 rubber, with adjustments made to account for the different dimensions used in Hypercar. Suspension kinematics and compliance were based on those of real Le Mans prototypes, providing a reasonable representation of an LMH vehicle. Regarding aerodynamics, aero
maps were generated by fitting a mathematical model to a car with similar characteristics, sensitivities and performance to those that LMH/LMDh teams are targeting. These mathematical models were then manipulated to investigate how different sensitivities would influence the cars’ performance while still adhering to the regulations.
The track model used in the simulations was constructed from logged data acquired at Le Mans, taking elevation changes into account.Lap time simulation results come with caveats and it is worth bearing two key points in mind:
- Since the vehicle model is not based on detailed data of a specific car, and due to the nature of simulations themselves, the results should notbe looked at in terms of absolute performance, rather to identify trends following specific changes to vehicle properties. Furthermore, it must be remembered that the accuracy of the track model can be crucial to the final simulation results.
- The results should be considered as something like an upper envelope, both in terms of absolute performance and its relative changes.
The reference model as set up for the first runs produced a lap time of 3:22.099 (Figure 3). This is about 0.9 seconds faster than Ferrari’s pole position, clocked at 3:22.982. In relative terms, the mismatch is around 0.4%.
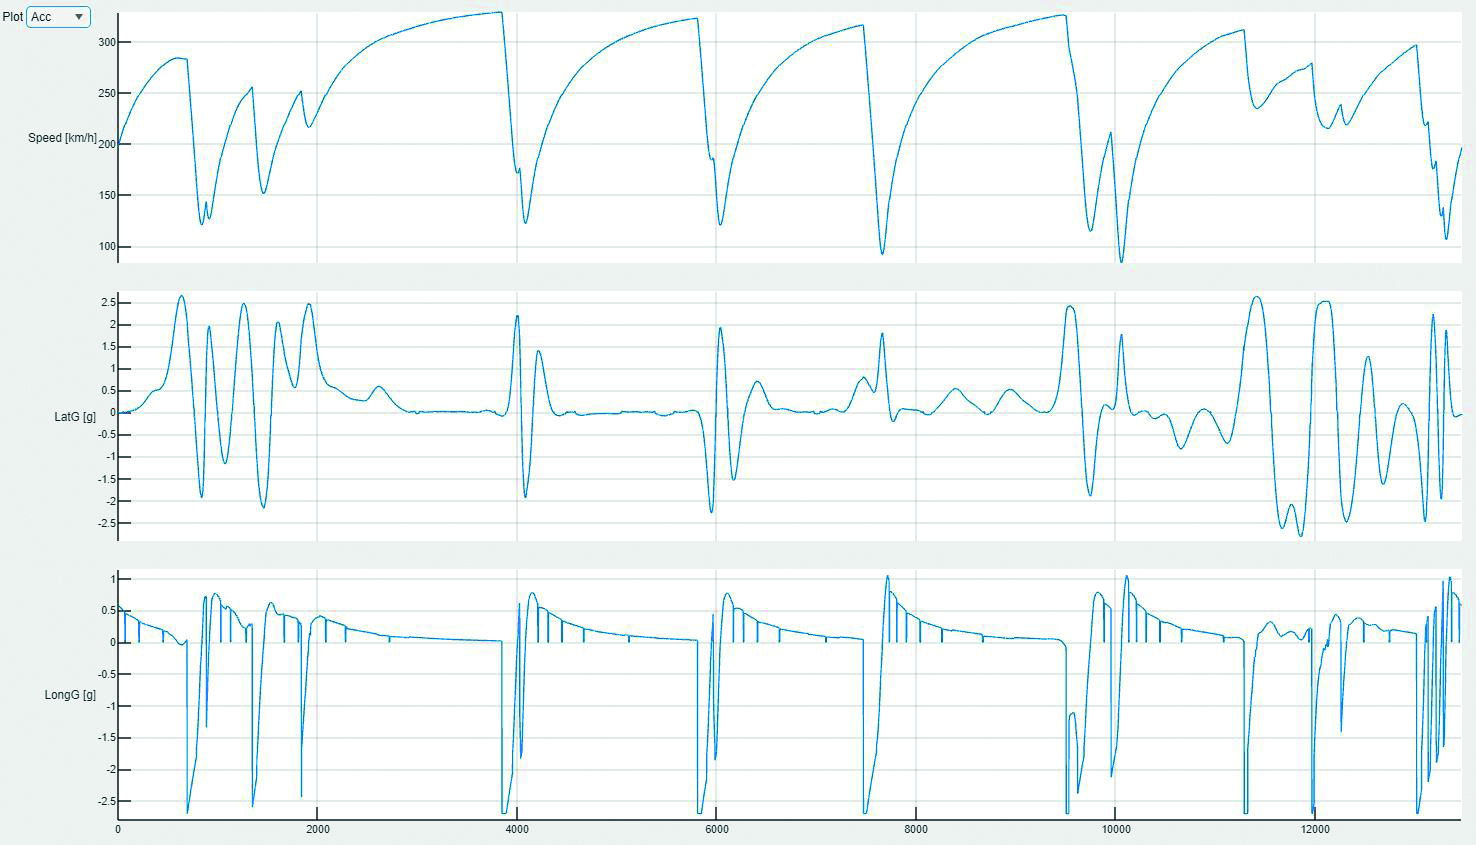
The model achieved a top speed of 329.2km/h on the first Hunaudières straight, while maximum lateral accelerations were achieved in the Porsche curves, specifically between the 11,000m and 12,450m distance marks.
Analysis
The initial investigation focused on a simple mass scan, taking into account the weights assigned to each car by the BoP table for Le Mans. Figure 4 displays the results in tabular and plotted forms.
The results reveal a sensitivity of about 0.405 seconds for a 10kg change in vehicle mass. It is apparent that Toyota had to endure a significant performance penalty of about two seconds to level the playing field for privateers competing against the fastest cars.

With the late BoP adjustment only changing the mass assigned to some cars, the next logical step was to quantify the performance change of each car whose weight was modified between Le Mans and the previous race in Spa Francorchamps. Figure 5 summarizes these results, with each adjusted car marked in a different color.
If all cars had started at the same level, the performance difference between Porsche and Toyota due to the BoP in Le Mans would have been over 1.6 seconds. In other words, the regulators estimated that LMDh Porsche needed a boost of 1.6 seconds to be competitive against Toyota.
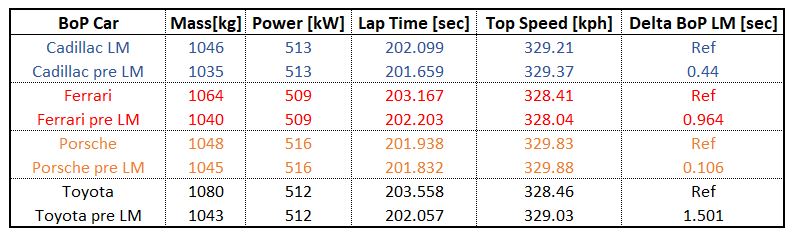
In terms of race results, while Ferrari’s performance was slowed down by about 0.964 seconds, Toyota’s performance was reduced by 1.5 seconds, meaning over half a second per lap more than Ferrari.
To put this into context, the winning Ferrari car (n.51) produced an average lap time about 0.42 seconds faster than Toyota car n.8’s fastest driver. When considering the average of the best 20% green laps, Ferrari n.51 was ahead of Toyota n.8 by about 0.3 seconds.
Interestingly, the fastest car on track was Ferrari n.50, about 0.6 seconds quicker than the winning sister car and 0.9 seconds faster than Toyota n.8, based on the average of the best 20% green laps.
Performance nuance
As for whether the BoP adjustment was excessive, that is for the reader to decide. However, other aspects related to powertrain and aerodynamics may explain why such significant performance differences between cars need to be ‘artificially’ corrected by adjusting the BoP.
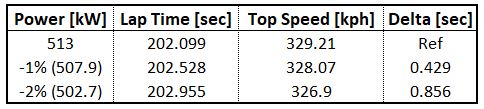
To understand the impact of ensuring that power measured at the wheels is kept under the regulation limit to avoid disqualification, the effect on performance can be quantified with a power scan. The results of a power reduction (or margin) of 1% and 2% are shown in Figure 6. These values have been chosen as they should provide a realistic representation of the safety margin teams typically implement.
While a 1% change in engine power may seem small, it results in a lap time deterioration of over 0.4 seconds at Le Mans. Figure 7 provides a comparison of lap times between the baseline and the -2% power configuration.
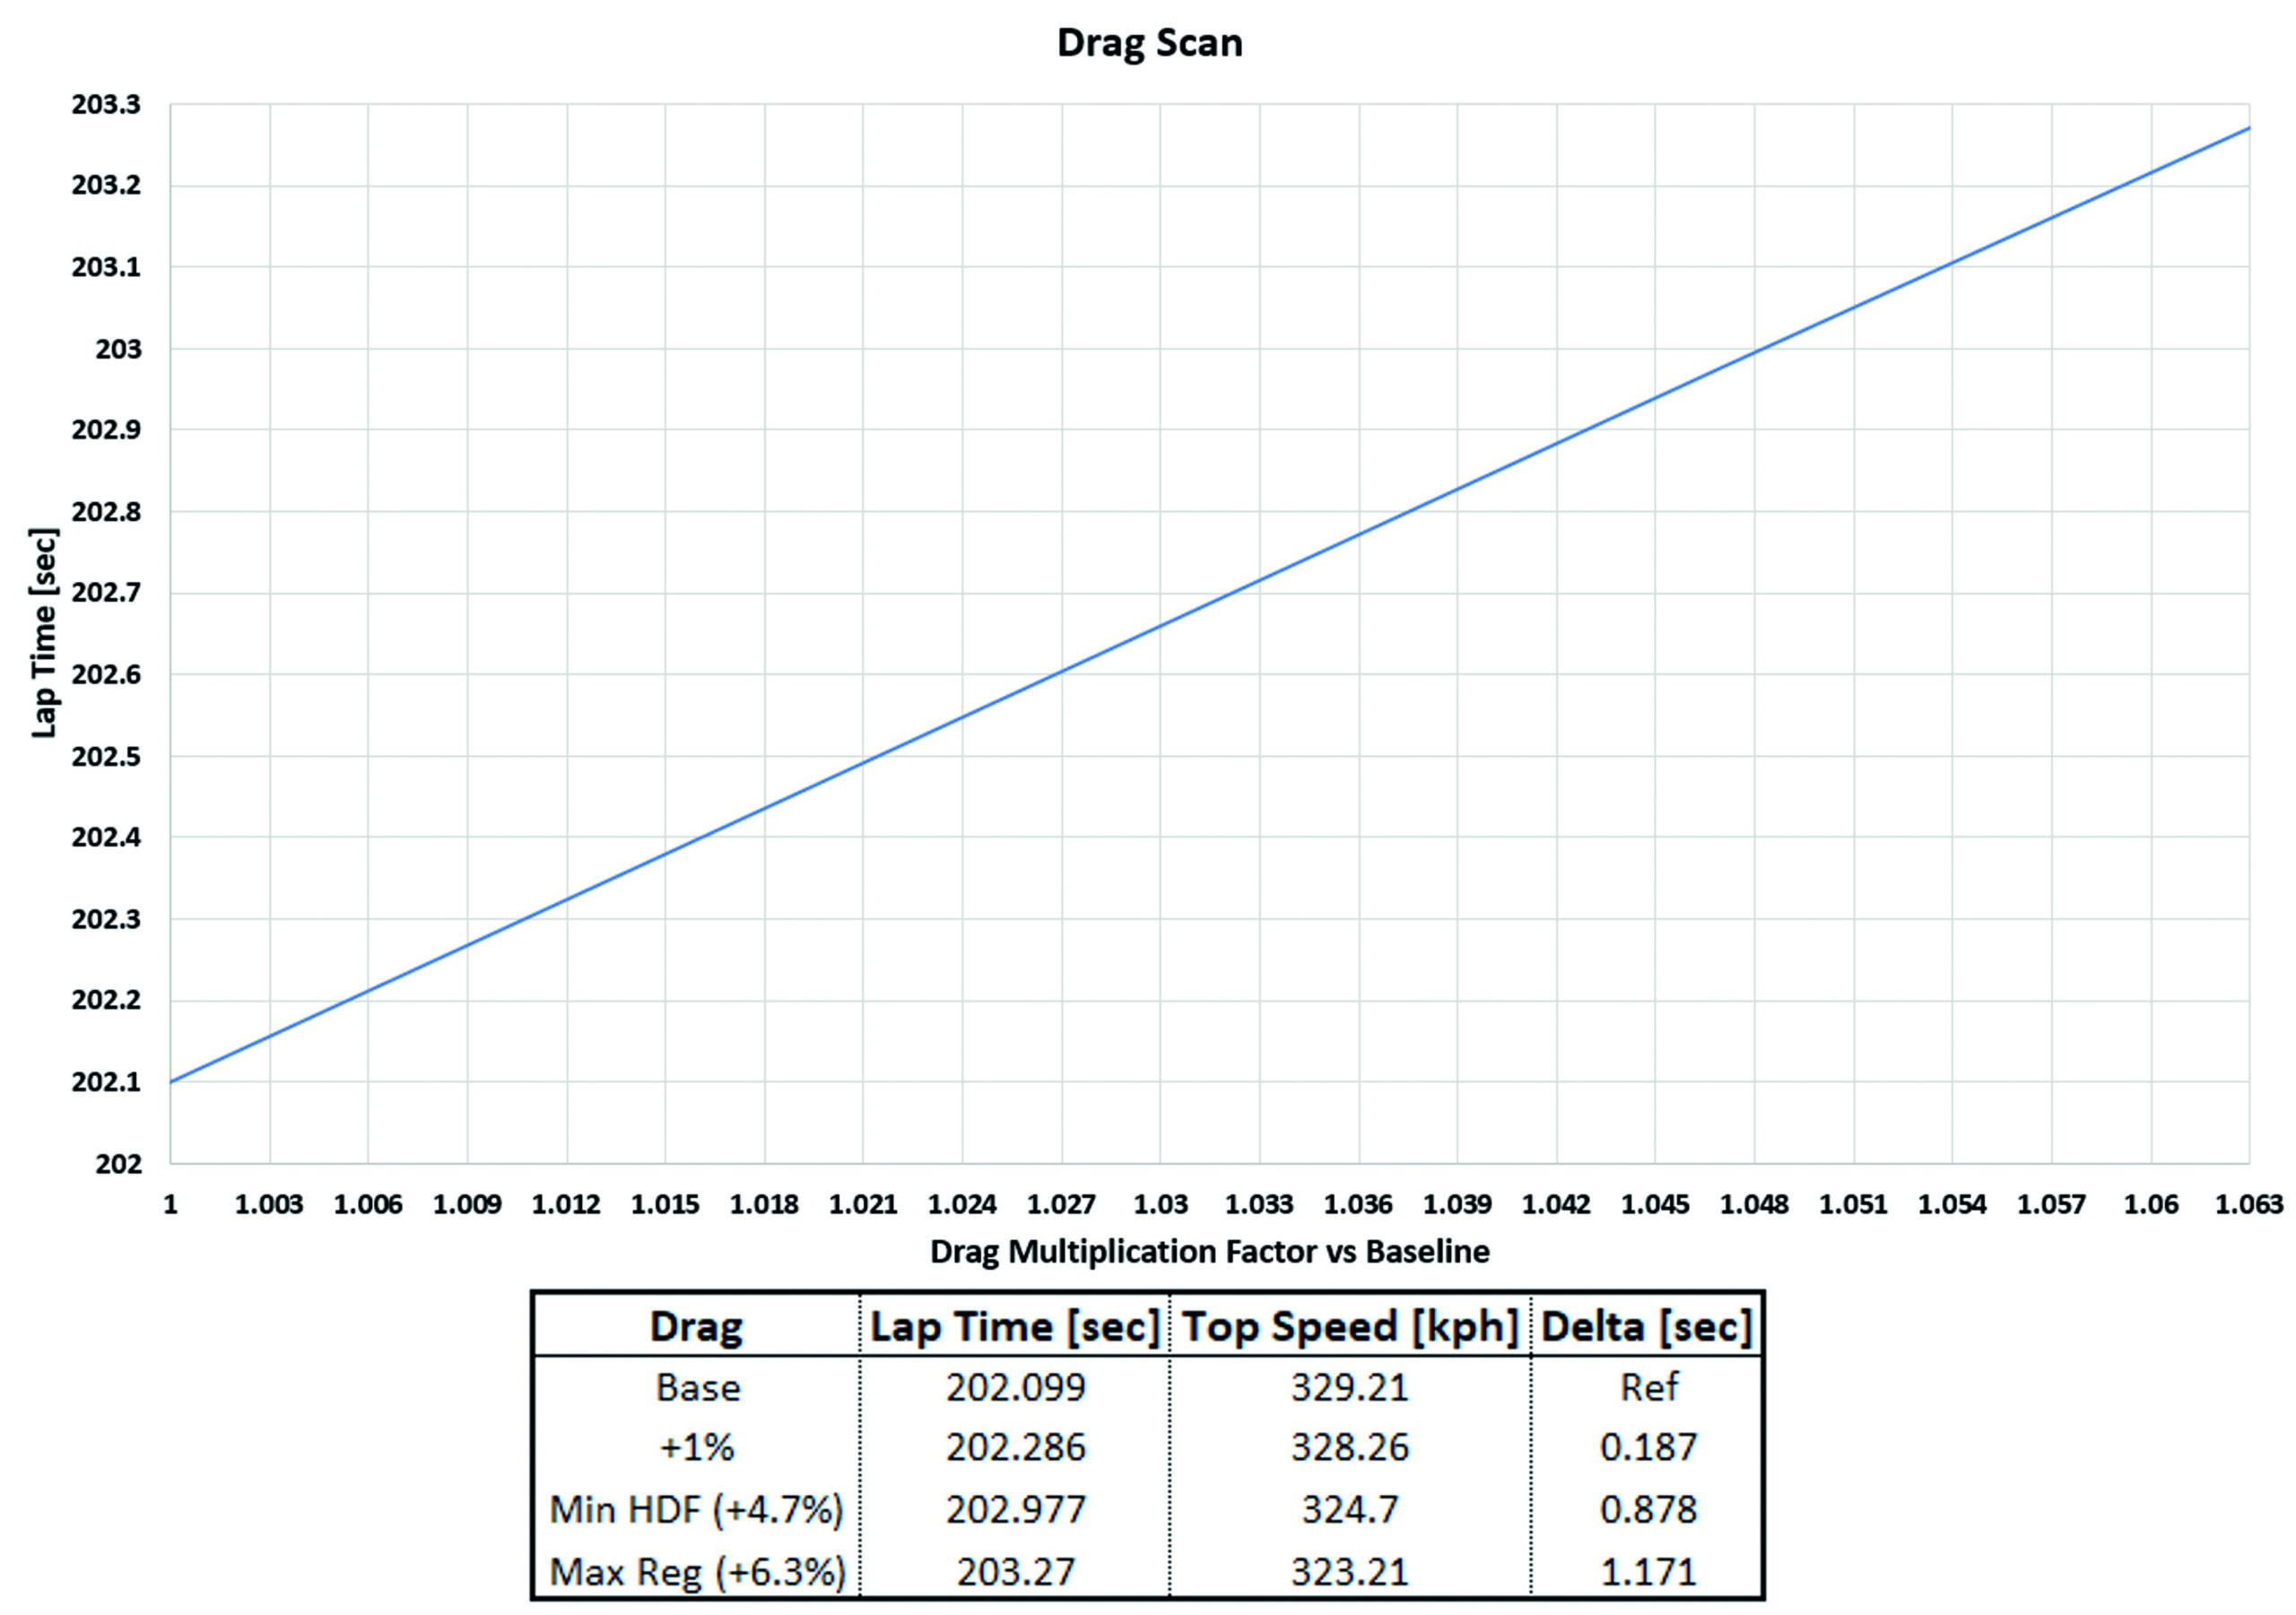
Now, let’s explore scenarioswhere a car does not fully exploit the aerodynamic homologation window shown in Figure 1. Two specific scenarios were investigated: one where the car does not meet the minimum drag target while remaining at the minimum downforce level (lower aerodynamic efficiency, depicted on the left edge of the trapezoid in Figure 1), and another where the car experiences an increase in both downforce and drag while staying within the efficiency edge allowed by the rules (lower diagonal of the trapezoid in Figure 1).
The first scenario can be analyzed with a drag scan, and the results are summarized in tabular and plotted forms in Figure 8. The findings suggest that balance of performance corrections would be necessary to compensate for a car that is not optimally designed in terms of aerodynamic performance. The impact of drag on performance at Le Mans is considerable, with a 1% increase in drag resulting in approximately 0.19 seconds of lap time and slightly less than 1km/h reduction in top speed.
the same
The second scenario was analyzed by proportionately increasing both drag and downforce (though not by exactly the same amount because of slight efficiency changes) while maintaining a constant aerodynamic balance through a reference fast corner. This was achieved by adjusting the static rear ride height. The results are summarized in Figure 9.
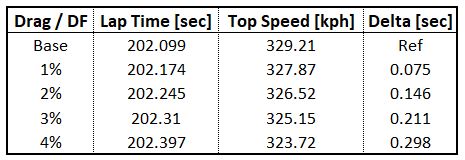
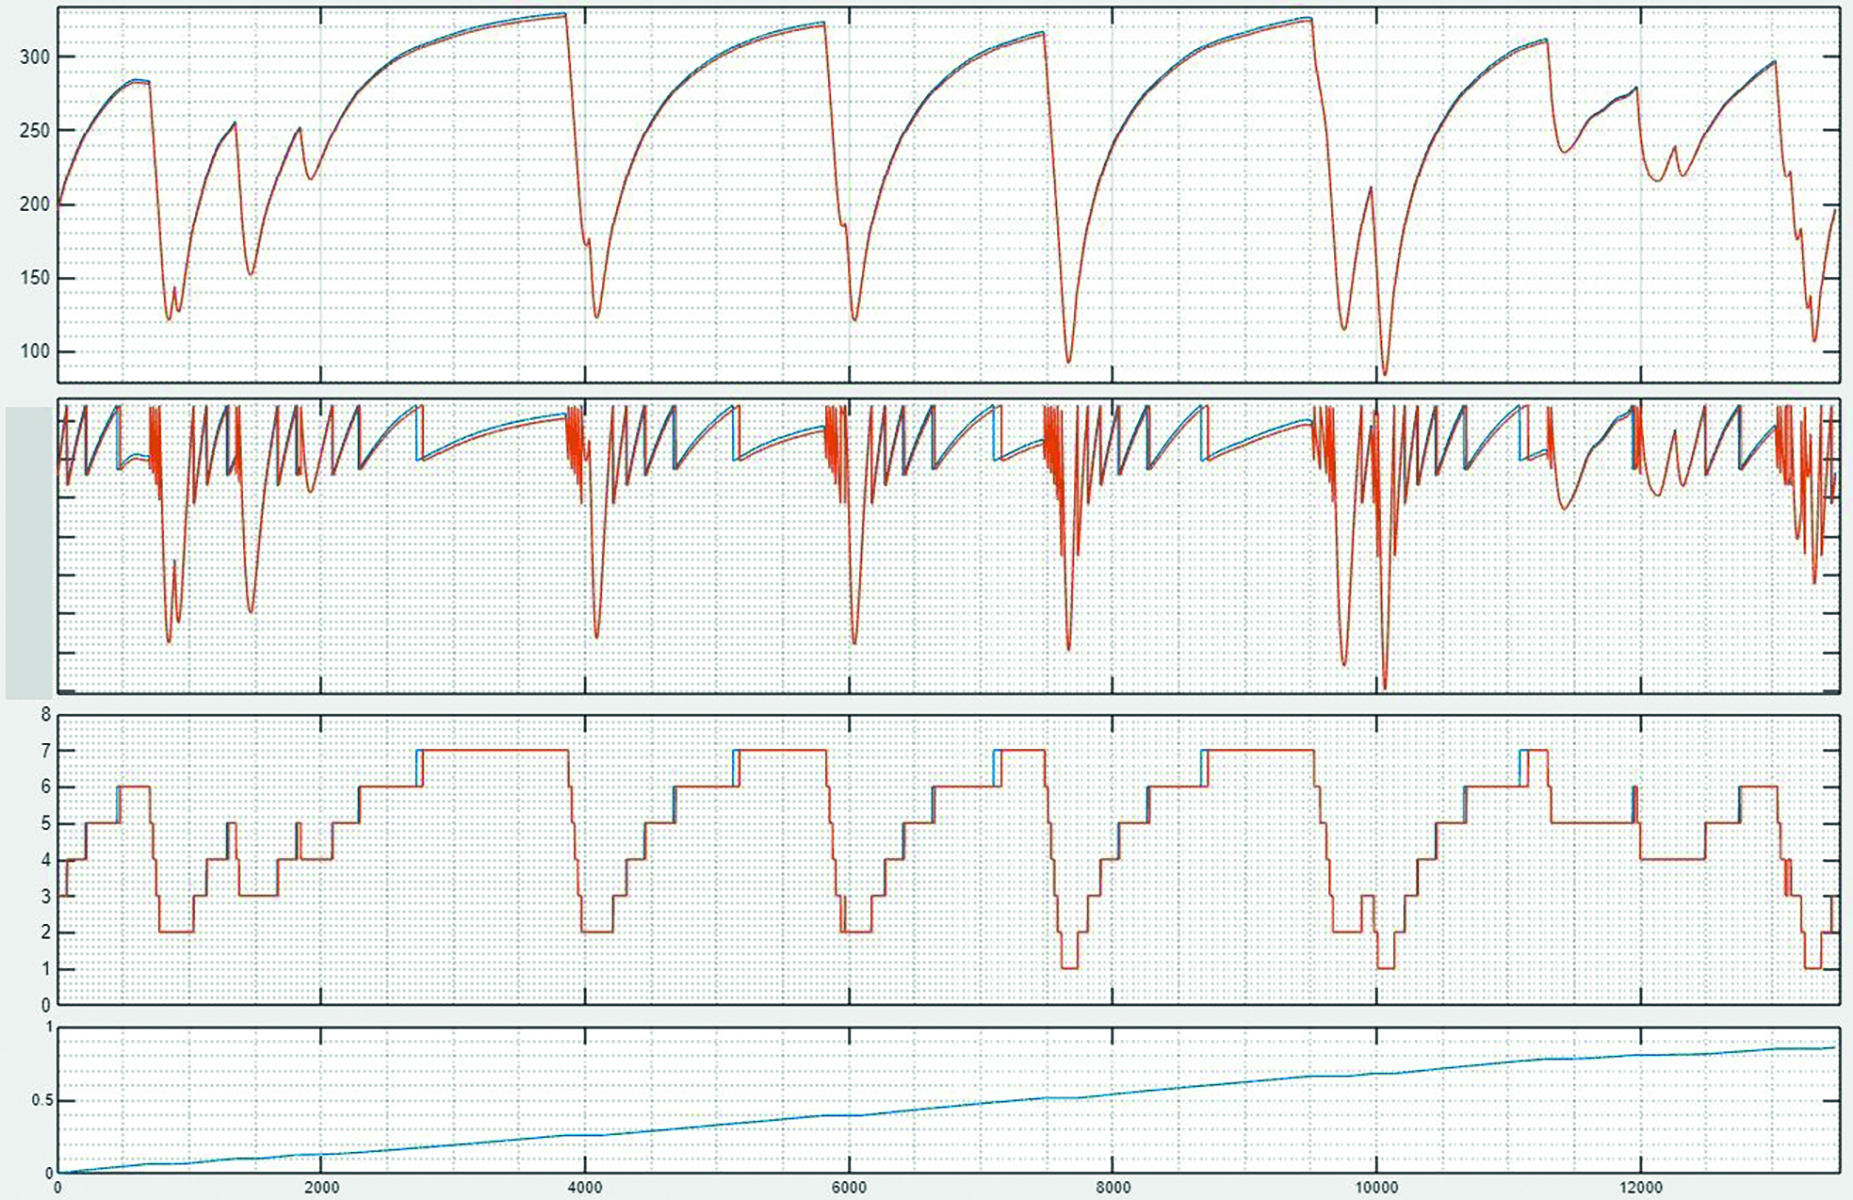
This analysis represents a scenario where a car, either due to design considerations or setup requirements, operates at the maximum aerodynamic efficiency allowed by the regulations but does not reach the lowest permitted level of drag or peak downforce. The increase in downforce and drag was limited to around 4%, as the rules specified a maximum difference of 4.5% between minimum and maximum downforce. Consequently, the difference in lap time between the lowest and highest downforce/drag setup is approximately 0.3 seconds, with a top speed reduction of 6.5km/h. Figure 10 provides a comparison between the base configuration and the highest downforce/drag setup considered in this analysis.
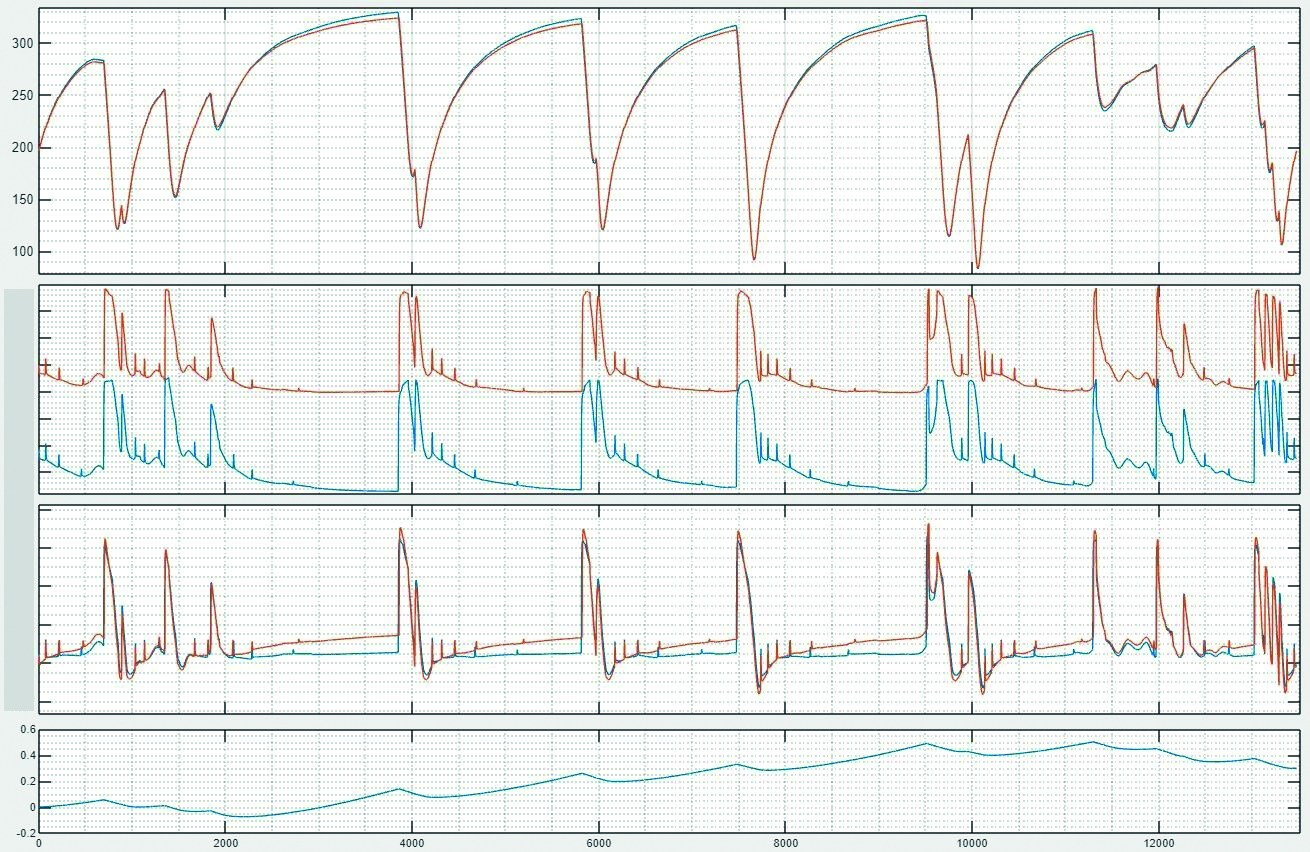
This gives a compelling visual representation of why drag is crucial in Le Mans. By comparing the time and speed traces, it becomes evident that the orange run is faster in each corner, particularly the faster turns. However, the gains made in corners are overshadowed by the lower straight-line performance. The second trace clearly indicates higher downforce for the orange run, while the third highlights the consistent aerodynamic balance in the faster corners, where it makes the greatest difference.
In the final analysis for this article, we delve into a case where the car, while positioned at the same point (minimum drag and downforce) within the aerodynamics homologation box, has a different aerodynamic map from the baseline.
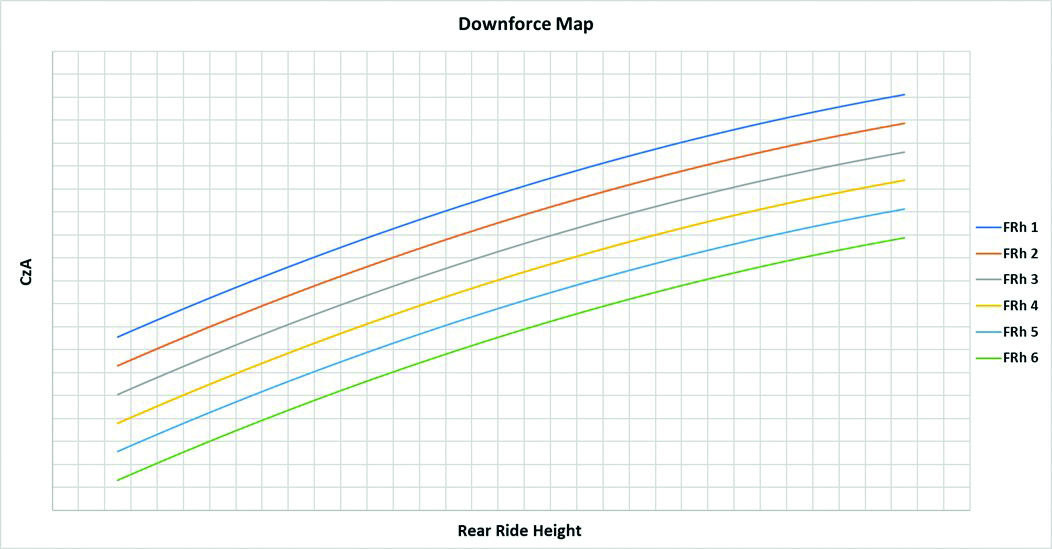
As previously explained, the aero maps were generated using equations, with coefficients fitted to a car similar to an LMH/LMDh in terms of key aerodynamic features, and then scaled to meet regulations. This allowed selective modifications of drag and downforce sensitivity to ride heights. This process could be used to set performance targets for a team’s aerodynamics department.
In the first step, the drag sensitivity to rear ride height was reduced by approximately half. In the second step, downforce sensitivity to rear ride height was also diminished. The results are summarized in Figure 11.
As expected at Le Mans, the most significant effect is produced by varying drag. Reducing drag rear ride height sensitivity results in a lap time drop of over 0.4 seconds while increasing top speed by about 1.5km/h. This is because the drag homologation target applies to a specific driving condition, and ideally the car would maintain this minimum allowed drag across all ride heights.
Interestingly, although reducing downforce sensitivity to rear ride height has a smaller impact on lap times, it still leads to an improvement. If designing for lower drag sensitivity to rear ride height also means lower downforce sensitivity, the advantage becomes clear. Figure 12 illustrates a comparison between the results of the simulation for the base setup and the lower downforce and drag sensitivity setup.
The setup with lower rear ride height sensitivity results in lower drag (better straight-line performance) and higher average downforce over a lap. In other words, both top speed and corner speed improve.
In conclusion, this article highlights how the current WEC top class, despite strict regulations limiting vehicle performance in various ways, still offers significant opportunities for optimization, hence why it is deemed necessary to implement a BoP system to level the playing field.
Though purists find this approach disturbing as it artificially brings cars to a similar performance level, it cannot be denied that it has led to exciting races and attracted numerous prestigious manufacturers to the LMH class, not least due to the much lower budget that is required to compete compared with the relatively open development of LMP1.
Class wars
The 2023 edition of the 24 Hours of Le Mans brought a thrilling spectacle thanks to the Le Mans Hypercar (LMH) class featuring multiple manufacturer and privateer entries. Although the regulations for this class remained largely unchanged since their implementation in 2021 for the World Endurance Championship and Le Mans, 2023 saw the arrival of major players including Ferrari, Porsche, Cadillac and Peugeot, alongside privateer teams such as Vanwall and Glickenhaus. This impressive line-up saw a stellar grid of 16 cars in the top class.
One of the reasons for the success of this event was the blending of WEC technical rules with those of IMSA’s GTP class (for LMDh cars). These LMDh cars are built on a ‘standard’ LMP2 chassis, which must be provided by one of four chosen chassis manufacturers: Dallara, Oreca, Ligier and Multimatic.
Ensuring a balanced performance window for both classes was a crucial element that allowed LMH and LMDh/GTP cars to compete together. The regulations were designed to ensure that all cars would deliver similar performance on the track. This was achieved by setting the target aerodynamic efficiency (downforce to drag ratio) for LMH/LMDh cars at least 50% lower than that achieved by LMP1 cars. Additionally, specific parameters were defined to control downforce and drag figures within a specified homologation window. To level the playing
field further, the class implemented a BoP system. This allowed regulators to adjust various parameters, such as the car’s overall mass, maximum power and energy use during a stint. The intention was to prevent any team from gaining an advantage and maintain competitive racing.
Despite the regulations’ efforts to limit key performance drivers, the need for a BoP adjustment prior to Le Mans, forced through without the agreement of the teams, arose due to what the ACO and FIA called a performance differential across the field that was ‘greater than anticipated’.